Chronic pain
There are two maps for each of the following sections – pain in different parts of the body, factors that impact on MSK problems, other health conditions, physical activity and informal care. The colour maps present the amount of each health issue in each area. The second map, in grey, presents the amount in comparison to the other areas and in this we can highlight which areas have lower and higher levels.
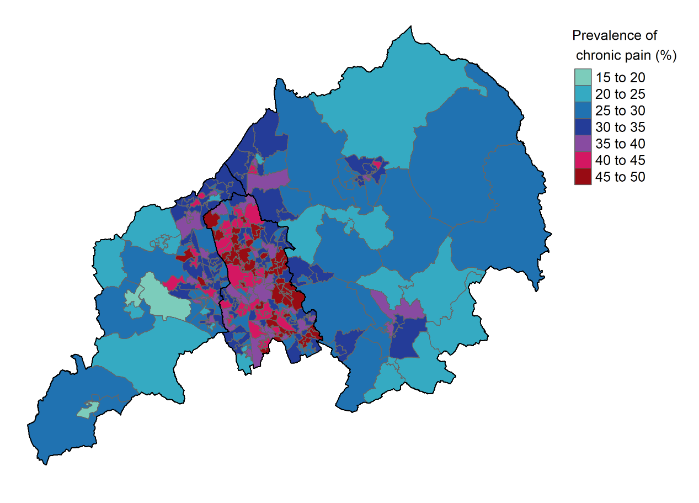
Chronic pain
- The map shows the proportion of people in each area who have experienced chronic pain. That is, they have experienced pain in any area of the body on most or all days during the past 6 months. The proportion for areas ranged from 18.6% and 50.1%. On the map the lighter areas are where around 1 in 5 people experience chronic pain. In the darkest red areas almost 1 in 2 people experience chronic back pain.
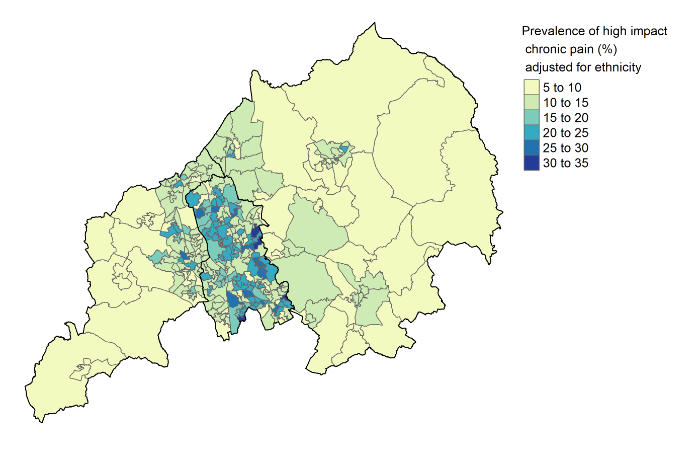
High impact chronic pain
- The map shows the proportion of people in each area who have experienced high impact chronic pain. That is pain that impacts on their activities on most or all days during a six month period. The proportion for areas varies from 6.2% to 33.1%. On the map the lighter areas are where between 1 and 20 and 1 in 10 people experience pain impacting on daily activities on most or all days. In the darkest blue areas almost 1 in 3 people experience pain impacting on daily activities on most or all days.