Typical surveys
Cave system
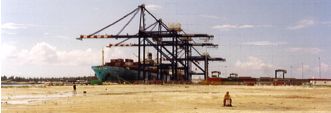 Freeport Container terminal will become one of the largest ports of its type in the world, with an ongoing development and expansion plan that will result in a quayside in excess of 2km in length. The complete microgravity survey culminates in approximately 7000 gravity stations, acquired over a period of 5 weeks. The quay adjacent to the existing port must be completed early in the civils construction programme and consequently this area must be surveyed first.
 This portion of the site measures 60m x 95m and includes around 300 stations set out on a 5m orthogonal grid. The main contractor still requires some convincing as to the microgravity technique and its validity on site, so this certainly needs to run smoothly as the microgravity method is under close scrutiny. The surrounding terrain is known to contain many sink holes and ‘Blue Holes’ so the client is fully aware that cavities exist. The field crew have already located some!
 With a field crew of four on-site, two are assigned to this area and complete the acquisition in two days. The raw data shows the overriding influence of the regional gravity trend but is also split due to acquisition taking place over two separate days. The instrument drift and Earth Tide influences are clearly separating the two days data.
 The application of the drift correction, determined from on-site testing of the gravimeter and interpolation between Base Station readings, brings the data nearer to a common datum. A small shift still exists across the data due to the variation (up to approximately 250 microgals/day) in the Earth's gravity caused by the Earth Tides alone.
 The data is now consistent across the site and a couple of interesting features are evident on the map. There is a significant N-S trend of higher gravity and a region of higher gravity along the southern edge of the map. Gravity increases the nearer to the centre of the earth it is observed i.e. with decreasing elevation. On-site, you recall the difficulties of observing one line of stations that fell in the bottom of a 1.5m deep drainage ditch, and the nearby launching slipway to the harbour. These areas were lower than the surrounding topography and therefore without the application of an elevation correction are clearly seen in the data set.
 With the elevation correction applied, together with the free air correction, the plot now looks sensible and represents the regional gravity together with any much smaller scale features that we, and the client, are interested in. The variation due to the regional trend across the map is approximately 0.5 milligals (500 microgals).
In order to examine the small scale features within the entire gravity data set, a three-dimensional polynomial surface must be mathematically subtracted from the data. The skilled removal of this surface is termed residualising.
 The removal of a polynomial surface results in the production of the Residual plan. The location and trends of the cave systems are now clearly visible. In conventional surveys the anomalies identified would usually be investigated by targeted probe drilling. In addition to the confirmatory drilling on-site, in Freeport we were extremely fortunate. Commercial divers were inspecting the cut face of the new quay for verticality and collapse prior to sheet pile driving to construct the harbour wall.
The divers were also active cave-divers in their own time and after meetings with the client, it was agreed that they would investigate the anomalies identified from the microgravity survey.
After two days of diving, we were provided with perhaps the most novel and unusual ground truth. The divers located an access into the cave system from the cut face at a depth of 45 feet. The cave system was explored for a distance of 50 metres from the face with a live video link to the surface.
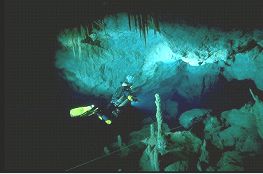 The diver reported good agreement between his subterranean mapping and the gravity plan and culminated in providing a “height of cave” scale comparison to our microgal anomaly scale. The diver reported the cave system to be like a submerged multi-storey car park with inclined levels and large stalactites supporting the roof.
The lines shown on the plan above were sketched underwater by the diver to represent the extent of the cavern system he was in! Needless to say, the main contractor was now fully aware of the usefulness and accuracy of the method and the microgravity was made top priority on site in terms of clearing the remainder of the site and allowing ready access to the field crew.