My Keele Journey: Student Engagement Dashboard
To further support our students and identify those who may be in need of additional support, we use a student engagement dashboard, called My Keele Journey.
The My Keele Journey dashboard pulls together information from a range of sources to show a student’s overall engagement with academic life – including access to the KLE, physical Library resources, and Microsoft Teams, among other factors.
You can monitor your own levels of engagement throughout your learning journey, and will be able to compare your engagement with your wider cohort.
Selected staff will also have access to relevant student records for their role – for example your academic mentor will have access to the records of their mentees, or your School's Student Experience and Support Officer (SESO) will have access to information about students that they support.
All undergraduate and postgraduate taught students have access to My Keele Journey.
It is really important that at the end of your studies you have developed subject knowledge as well as the skills and competencies recruiters are looking for. This is part of the Keele Distinctive Curriculum and My Keele Journey helps you do this.
The dashboard is a tool designed to be used alongside other more traditional methods of support and feedback, and is a resource to help you reflect on the way you engage with your studies e.g. to see how effectively you use certain resources.
The privacy notice can be found here: Privacy Statement for My Keele Journey Engagement Dashboard
The video below provides an introduction to the My Keele Journey dashboard.
My Keele Journey can also help your Academic Mentor and Student Support staff tailor individual support and guidance designed around you, through early intervention.
The video below shows a mock Academic Mentor meeting, providing an example of how the dashboard can be used in discussions with your Academic Mentor.
Your engagement is measured in various ways, including:
- KLE log-in and course interactions
- Interactions with Microsoft Teams meetings, calls and chats
- Library use (loans, loan renewals and requests)
- Keele University WiFi log-in
For each element, no details of the nature or length of the interaction are recorded, just a usage figure. This data is then calculated by My Keele Journey to provide your engagement levels, which could be one of six:
- None
- Very low
- Low
- Partial
- Good
- High
These six levels are illustrated using the following icons:
|
|
|
|
|
|
|


The engagement ratings are designed to offer some feedback about your patterns of engagement over time, to help guide your own activity with your studies. They also enable staff to tailor academic and pastoral support for you. It is important to note that they are never used as part of the assessment process or to instigate punitive measures such as disciplinary or misconduct investigations.
Your individual engagement is plotted on a graph to show your engagement pattern, as well as the average engagement for your course. The graph and engagement rating is updated every night. This means you don’t have to wait for assessment results to get an idea of how effectively you are engaging.
On the graph below the blue line is your engagement, the red line is your course peers’ (cohort’s) average engagement.
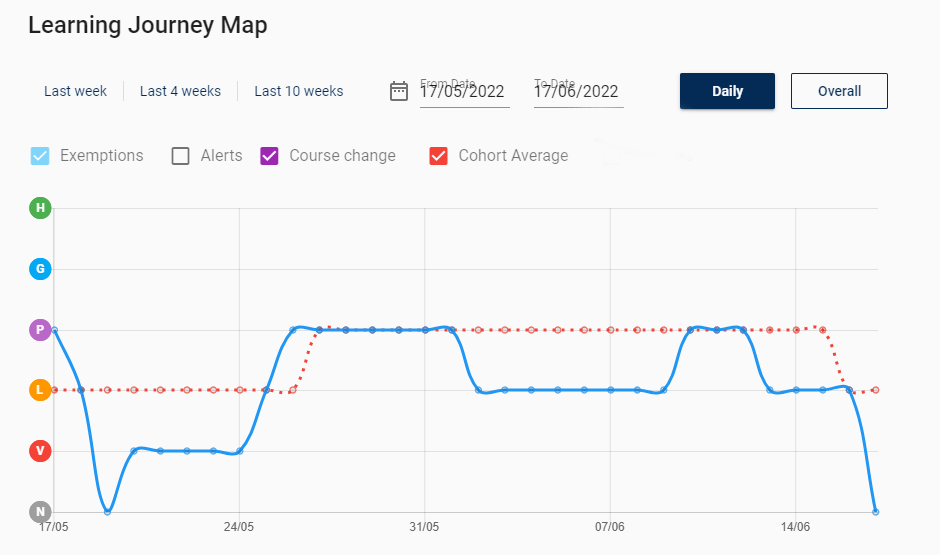
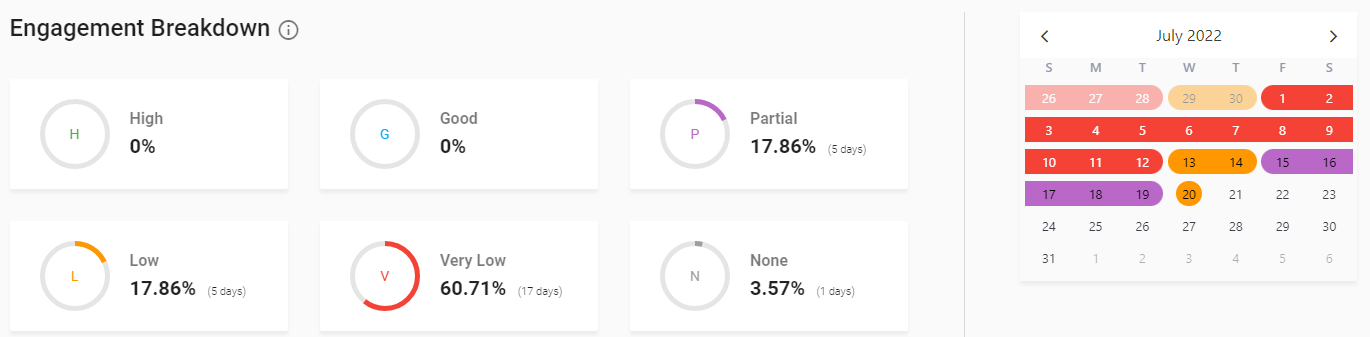
Engagement is also summarised in a bar chart. This represents the percentage of days you have been in each engagement category for the same time period as the graph. This can be changed by changing the date range for the graph.
Frequently Asked Questions
There is strong correlation between engagement and achievement, though engagement does not guarantee success, evidence from other universities has shown it is an important factor in success.
You can find the link to my Keele Journey within the KLE home page or directly here Student Engagement dashboard
There is a range of information that you can explore in the different sections:
- Engagement: Your engagement graphs and charts
- Profile: Key information about you and how to contact your tutor
- Resources: A breakdown of the individual resources you have used.
Student Support services
- Attendance: An overview of your attendance
- Assessment: An overview of your Assessment Results
It is best to get into a habit of regularly logging in throughout the year. Where a similar dashboard has been used at another university, first year progression has been seen to be 20% better for those with the highest number of regular logins to the dashboard than for those with the lowest.
Here are some pointers on what to look for and think about whilst using My Keele Journey:
- Are my contact details up to date?
- Do I know who my academic mentor is?
- Have I reflected on, planned and set goals for the year?
- Am I engaging with my course? Should I check my daily engagement rating?
- Am I using a wide range of resources?
- Am I getting the grades I want?
- Have I reflected on and planned goals for next year?
There are help pages available in the dashboard with more frequently asked questions.
- For course-specific help you can speak to your academic mentor, or for more general support contact Student Services.
- If students require help logging into the system they should contact it.service@keele.ac.uk
- If students require help using the system and cannot find the answer on this page then they should contact their Academic Mentor
- For technical support with My Keele Journey, contact the IT Service Desk.
To view the Student Attendance & Engagement Policy, please click here.
The Student Data Charter can be accessed here: Student Data Charter Principles
Further Resources:
There are some further resources supplied by SolutionPath. The information is generic but it may be of interest.
Please note that the alerts and exemption functions are not active in My Keele Journey. The engagement ratings used at Keele are titled High and Good.