
Your harmonised IPD Meta-Analysis dataset is ready.
How should you analyse it?
- A two-stage approach can be used for meta-analysis. The first stage typically involves a standard regression analysis in each trial separately to produce aggregate data, whilst the second stage uses well-known (e.g. inverse variance weighted) meta-analysis methods to combine this aggregate data and produce summary results and forest plots
- For synthesis of randomised trials evaluating a treatment effect, the first stage produces estimates of treatment effect for each trial such as mean differences for continuous outcomes; log odds ratios or log risk ratios for binary (or ordinal) outcomes; log incidence (rate) ratios for count outcomes; and log hazard ratios for time-to-event outcomes. Adjustment for key prognostic factors is recommended within each trial, and each trial’s analysis should be appropriate for its design (e.g. accounting for any cluster randomisation, repeated measurements, etc.)
- In the second stage, the treatment effect estimates obtained from the first stage are combined assuming either a common-effect or a random-effects model. A common treatment effect model assumes that the true treatment effect is the same in every trial. A random treatment effects models allows for between-trial heterogeneity in the true treatment effect, and is more plausible because included trials often differ in their characteristics
- A frequentist or Bayesian estimation framework can be used. Bayesian estimation is appealing, to produce direct probabilistic statements that account for all parameter uncertainty, and to include prior distributions for the between-trial variance. In a frequentist framework, restricted maximum likelihood (REML) estimation is recommended for fitting the random-effects model in the second stage, with confidence intervals derived using the approach of Hartung-Knapp-Sidik-Jonkman
- Heterogeneity can be summarised by the estimate of between-trial variance of true treatment effects, and a 95% prediction interval for the potential true treatment effect in a new trial
- A meta-regression extends the random-effects model by including trial-level covariates (that define subgroups of trials) that may explain between-trial heterogeneity. However, meta-regression usually has low power and should be interpreted cautiously
- A two-stage IPD approach to estimating treatment-covariate interactions avoids aggregation bias by estimating treatment-covariate interactions in each trial separately, and then synthesising them in the second stage. This ensures that only within-trial information is used
References:
- Riley RD, Tierney J, Stewart LA (Eds). Individual Participant Data Meta-Analysis: A Handbook for Healthcare Research. Wiley 2021 (in-press)
- Riley RD, Lambert PC, Abo-Zaid G. Meta-analysis of individual participant data: conduct, rationale and reporting. BMJ 2010; 340: c221
- Riley RD, Debray TPA, Fisher D, Hattle M, Marlin N, Hoogland J, et al. Individual participant data meta-analysis to examine interactions between treatment effect and participant-level covariates: Statistical recommendations for conduct and planning. Stat Med. 2020;39:2115-37.
- Fisher DJ, Carpenter JR, Morris TP, et al. Meta-analytical methods to identify who benefits most from treatments: daft, deluded, or deft approach? BMJ 2017;356:j573
- A one-stage approach to IPD meta-analysis analyses the IPD from all trials altogether in a single statistical analysis
- This typically requires a generalised linear mixed model (GLMM) or a hierarchical survival (frailty) model, which extend standard models (such as linear, logistic, Poisson and Cox) used in a single trial setting
- A one-stage IPD meta-analysis utilises a more exact statistical likelihood than a two-stage meta-analysis approach, which is advantageous when included trials have few participants or outcome events
- One-stage IPD meta-analysis models usually include multiple parameters and these are estimated simultaneously. For each parameter (such as the intercept, treatment effect, residual variances) the analyst must specify whether they are common (the same in each trial), stratified (different in each trial) or random (different in each trial and assumed drawn from a particular distribution)
- Clustering of participants within trials must be accounted for (e.g. using a stratified trial intercept or random trial intercepts for GLMMs), as otherwise summary meta-analysis results may be biased or overly precise
- A stratified trial intercept is generally preferred, unless there are computational concerns. The use of random trial intercepts allows information about baseline risk to be shared across trials, which may compromise randomisation within each trial (e.g. when the treatment:control allocation ratio differs across trials)
- Restricted maximum likelihood (REML) estimation is recommended for one-stage models with continuous outcomes, with confidence intervals derived using the approach of Kenward-Roger or Satterthwaite
- For binary outcomes, unless most included trials have sparse numbers of events, REML estimation of a pseudo-likelihood is recommended
- Where REML or a pseudo-likelihood is not available or not appropriate, maximum likelihood estimation of a one-stage model with a stratified intercept can be improved by trial-specific centering of the treatment variable, and by deriving confidence intervals using the t-distribution
- A one-stage IPD meta-analysis for the estimation of treatment-covariate interactions must ensure that within-trial and across-trial information are separated out, by either (i) stratifying all nuisance parameters by trial, or (ii) centering the covariate by its mean and allowing the mean covariate value to explain between-trial heterogeneity
References:
- Riley RD, Tierney J, Stewart LA (Eds). Individual Participant Data Meta-Analysis: A Handbook for Healthcare Research. Wiley 2021 (in-press)
- Riley RD, Lambert PC, Abo-Zaid G. Meta-analysis of individual participant data: conduct, rationale and reporting. BMJ 2010; 340: c221
- Legha A, Riley RD, Ensor J, et al. Individual participant data meta-analysis of continuous outcomes: A comparison of approaches for specifying and estimating one-stage models. Stat Med 2018;37(29):4404-20
- Riley RD, Debray TPA, Fisher D, Hattle M, Marlin N, Hoogland J, et al. Individual participant data meta-analysis to examine interactions between treatment effect and participant-level covariates: Statistical recommendations for conduct and planning. Stat Med. 2020;39:2115-37.
- Riley RD, Legha A, Jackson D, et al. One-stage individual participant data meta-analysis models for continuous and binary outcomes: comparison of treatment coding options and estimation methods. Stat Med 2020;39(19):2536-55.
- Jackson D, Law M, Stijnen T, et al. A comparison of seven random-effects models for meta-analyses that estimate the summary odds ratio. Stat Med 2018;37(7):1059-85.
- An IPD meta-analysis may be conducted using either a one-stage or a two-stage approach
- Crucially, differences in one-stage and two-stage summary results will usually be small when the same assumptions and estimation methods are used
- When notable differences do arise, generally they are caused by a change in modelling assumptions and/or estimation methods, and not due to using a one-stage or two-stage process per se. Thus, the choice of model assumptions and estimation methods is more important than selection of a one-stage or two-stage approach
- An important exception is when most trials in the meta-analysis are small (in terms of numbers of participants or outcome events). In this case a one-stage approach is recommended as it uses a more exact statistical likelihood than that assumed in the second stage of the two-stage approach
- In other situations, researchers can feel free to choose either a one-stage or a two-stage approach, with due care given to their choice of modelling assumptions, parameter specification, and estimation methods
- Unless most trials in the IPD meta-analysis are small, generally the two-stage approach will suffice. It is also more accessible (especially for those familiar with conventional aggregate data meta-analysis approaches), and more easily enables visual summaries (e.g. forest plots). It is also more convenient for including trials that only provide remote access to their IPD (so cannot be merged with other IPD), and trials that only provide aggregate data
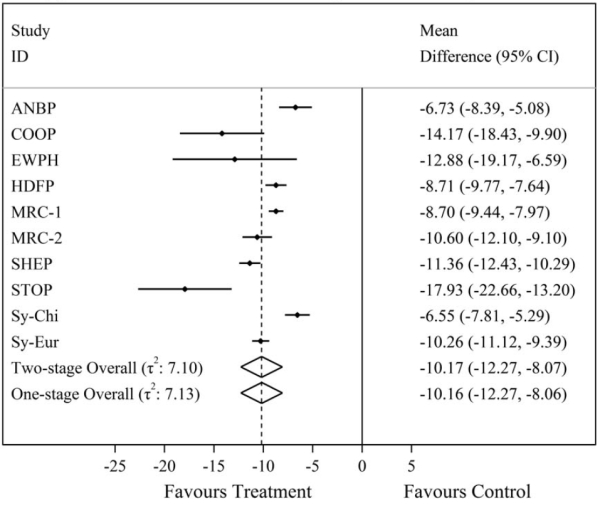
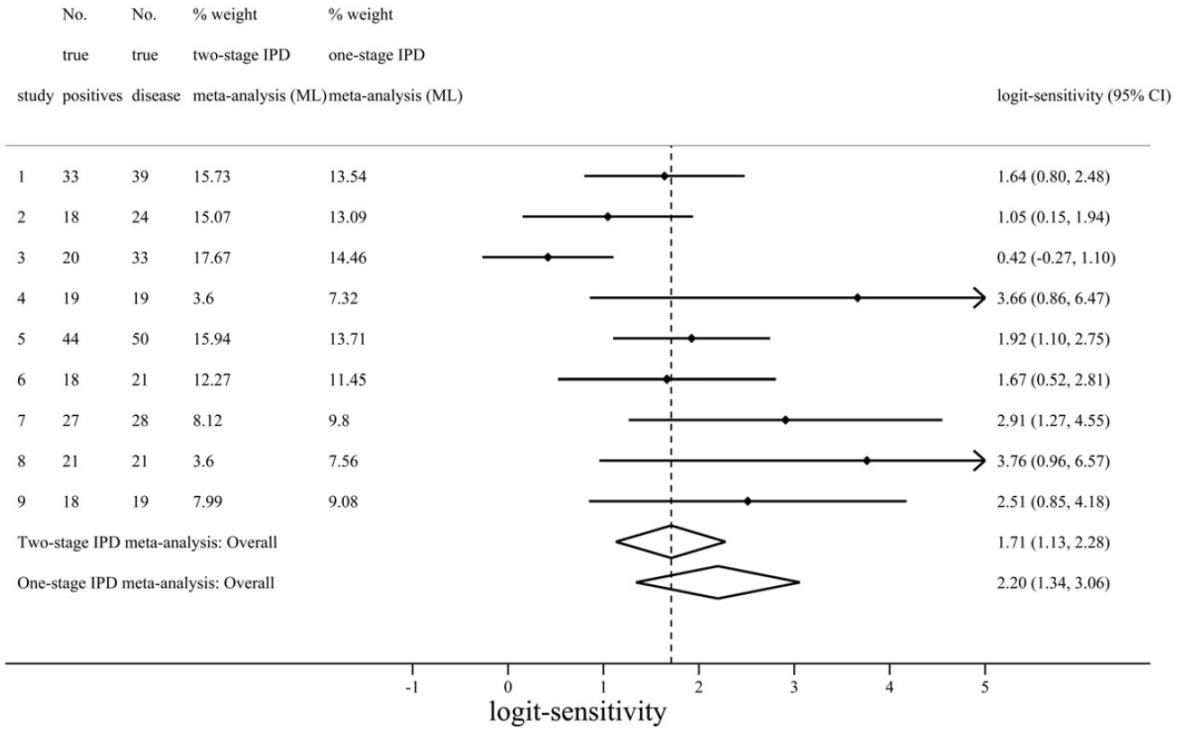
- Here are 2 examples where both 1-stage and 2-stage analyses were done in the same study. In the first example, the results for the 2 analytic methods are similar, whereas in the second example, the results are quite different.
| Figure 1 – Comparison of one-stage and two-stage IPD meta-analysis summary treatment effect results for the mean difference in final systolic blood pressure from a random-effects IPD meta-analysis of 10 trials evaluating anti-hypertensive treatment on systolic blood pressure. In this case, we can see the one and two-stage IPD meta-analysis results are almost identical using REML estimation. |
|
| Figure 2 – Comparison of one-stage and two-stage IPD meta-analysis summary results for logit-sensitivity of the positron emission tomography (PET) test for diagnosis of Alzheimer’s disease. Here we can see the results from one and two-stage analyses are distinctly different, corresponding to a summary sensitivity of 0.9 and 0.85 respectively. The difference here is mostly due to the assumptions of the two-stage approach not being met. As the nine included studies were small, with three having zero false positives, the normality assumption for effect estimates does not hold for two-stage meta-analysis here. In contrast, the one-stage approach does not require such assumptions as it models the binomial distribution of the IPD directly. |
|
References:
- Burke DL, Ensor J, Riley RD. Meta-analysis using individual participant data: one-stage and two-stage approaches, and why they may differ. Stat Med, 2017; 36(5):855-875 doi: 10.1002/sim.7141.
- Morris TP, Fisher DJ, Kenward MG, et al. Meta-analysis of Gaussian individual patient data: Two-stage or not two-stage? Statistics in Medicine 2018;37(9):1419-38.
- The flagship package for conducting a two-stage IPD meta-analysis is ipdmetan, developed by Fisher for use within Stata statistical software
- This package automates the calculation of trial-specific aggregate data (e.g. treatment effect estimates and their variances) from the first stage, and then produces summary meta-analysis results and a forest plot from the second stage. Example code is shown in the table below
- The package is applicable to IPD meta-analyses aiming to summarise a particular effect of interest defined by a single parameter in a regression model (such as a treatment effect, or another measure that can be estimated in a regression model, such as a prognostic effect or a treatment-covariate interaction)
- Other meta-analysis packages may also be useful for a two-stage approach. In particular, researchers could take the dataset of treatment effect estimates and variances obtained from the first stage, and use another package to fit their meta-analysis (or meta-regression) model in the second stage. For example, available packages in Stata include meta, metan, metaan and metareg. In R, suitable packages include the exceptional metafor, and also rmeta and metaplus, amongst others
- For a one-stage IPD meta-analysis, researchers need to use generic packages for fitting generalised linear mixed models or frailty survival models, such as lme4 in R, Proc MIXED in SAS and mixed in Stata. These require careful implementation to avoid modelling mistakes and estimation issues
References:
- Fisher DJ. Two-stage individual participant data meta-analysis and generalized forest plots. Stata Journal 2015;15(2):369-96.
- Debray TP, Moons KG, van Valkenhoef G, et al. Get real in individual participant data (IPD) meta-analysis: a review of the methodology. Res Synth Methods 2015;6(4):293-309.
|
Example and Stata code, based on: Consider the applied example of a two-stage IPD meta-analysis for a time-to-event outcome, assuming a common treatment effect. This case study is based on the IPD meta-analysis project of Crowther et al. Ten trials (with a parallel group design) were ultimately included, which provided IPD for a total of 28581 participants. Crowther et al. use this IPD to summarise the effect of anti-hypertensive in regards to all-cause mortality. They harmonised the IPD into a single dataset containing a single row per participant in every trial, with variables defining trial ID, treatment group (‘treat’), baseline systolic blood pressure (‘sbpi’), age, BMI, smoking status (‘smk’), length of follow-up, and event status at this time (dead: yes or no). In the first stage of the two-stage IPD meta-analysis approach the IPD for each trial was analysed separately, using a Cox regression model to estimate the unadjusted treatment effect (i.e. log hazard ratio) and its variance. In the second stage we fitted a random-effects meta-analysis model, to synthesise the treatment effect estimates whilst giving more weight to those studies with a smaller variance. The summary treatment effect estimate is a hazard ratio of 0.88 (95% CI: 0.79 to 0.98), providing strong evidence that anti-hypertensive treatment reduces the rate of all-cause mortality compared to the control group. There is no observed between-trial heterogeneity in the treatment effect (τ^2= 0, I^2 = 0%), and when repeating the approach after adjustment for pre-defined prognostic factors of age, BMI, SBP, and smoking, the summary results are very similar (hazard ratio of 0.87; 95% CI: 0.78 to 0.97). After opening the IPD meta-analysis dataset, the following syntax was used to implement the ipdmetan package and conduct this two-stage IPD meta-analysis adjusting for age, BMI, SBP and smoking: ipdmetan, study(trial) re(reml, hksj) forest(xtitle(hazard ratio) boxsca(30) xlab(0.2 0.5 1 2) astext(40)) hr effect(HR) : stcox treat smk sbpi age bmi The terms in the syntax are explained below:
There are many other options are available for ipdmetan. |